State of the Plate: What Americans eat

U.S. Department of Agriculture.
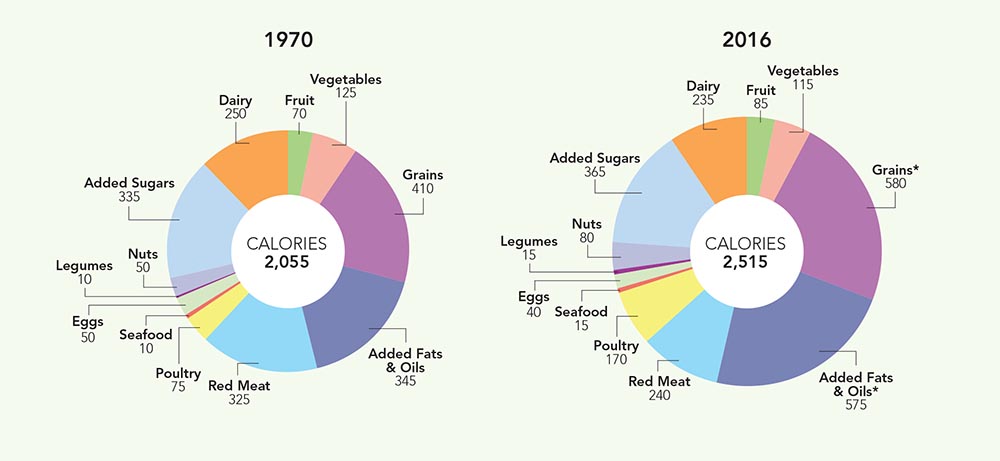
These snapshots of the typical American diet come from the U.S. Department of Agriculture’s estimates of what food companies and farmers produce. The take-home message: We could be doing far better.
Calories: Then and Now

The food supply’s calories per person per day have ballooned since 1970. Most of the 460 extra calories come from a jump in grains (largely refined) and fats. We’ve also swapped nearly 100 calories’ worth of red meat for poultry (yay!). The rest has barely budged, though sugar climbed until 1999 before falling.
*Numbers are from 2010, the last year the USDA tracked rice and fats & oils.
Note: Numbers are loss-adjusted.
Vegetables & Fruit

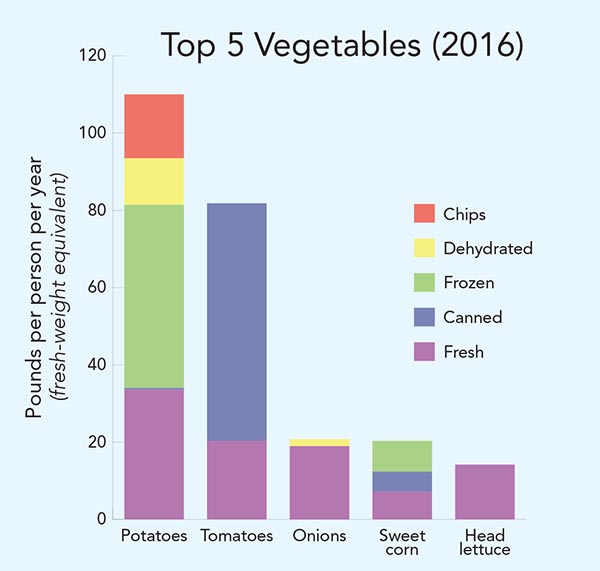
Our No. 1 vegetable? White potatoes. And we’re loading up on chips and fries, not baked potatoes. Most tomatoes are canned, and “head lettuce” is mostly nutrient-poor iceberg.

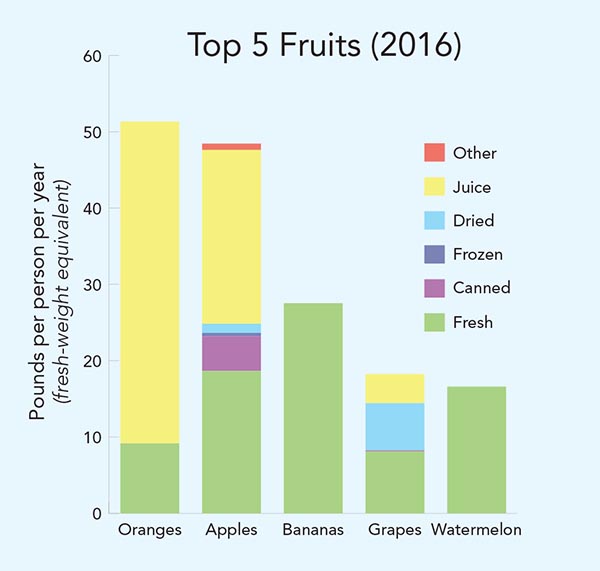
Most oranges get juiced, the bulk of our apples get juiced or canned, and half of our grapes become raisins or juice. Watermelon is fresh and nutrient rich, but it’s only in the top five because of its heavy rind.
Notes: Numbers are not loss-adjusted. The top 5 fruits and vegetables account for roughly ⅔ of the total.
Source: U.S. Department of Agriculture.
Tags
Topics

